Dataset Size
Medium (Source Aggregation)
Platform
Excel / BI
Uplift
Live Exec Visibility
Final Output
Dynamic Dashboard
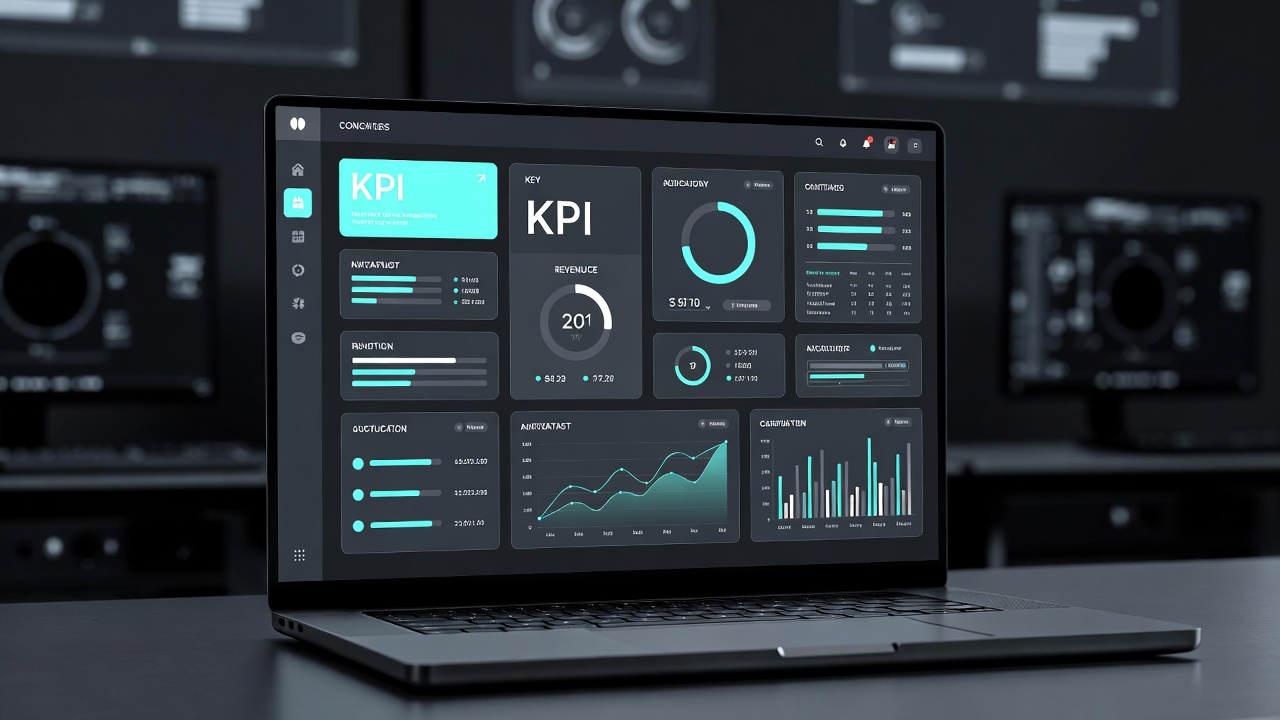
Managers were working with fragmented information coming from different teams and systems. KPIs were tracked manually, making it difficult to identify performance issues quickly.
Built a centralized KPI dashboard to monitor operational and business metrics in one place, using structured reporting logic and clear visual indicators for faster analysis.
Multiple operational sources
Centralized KPI logic
Real-time performance view
Improved executive visibility, reduced reporting friction and enabled more proactive control over performance across functions.
KPI dashboards help leadership teams move from reactive reporting to proactive decision-making by consolidating critical metrics into a single, easy-to-read view.
Reduced manual reporting workload by ~80%
Consolidated multiple fragmented KPI sources into a unified structure
Improved executive visibility across operational metrics
Enabled faster identification of performance deviations
I help businesses design dashboards, improve reporting systems and create clearer performance visibility.